Monitors performance of containerized business in real-time at a glance. Consolidated information of matrics-trace-log are presented for observability on Kubernetes' cluster, working note, and microservice application. This enables quick root cause analysis and action when a problem is spotted.
WhaTap provides information of integrated Kubernetes platform resources as well as the metrics, events, and logs of applications running in Kubernetes. A single view enables smooth communication between infrastructure and application owners, as well as visibility from various perspectives.
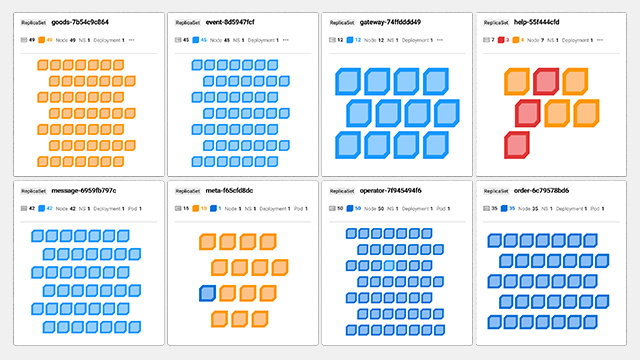
With the dashboard that has the resource usage and trend in containers and nodes, you can set to run containers on multiple nodes. User can take a closer look at containers and nodes, starting with the entire list of containers or nodes within the WhaTap project down to the details of individual objects.
Basic meta information of key resources can be checked on the container map, and the entire meta information of various components can be checked at a glance through a separate master meta dashboard. You can save time because there is no need to check meta data one by one by the command.
Log files and default outputs of containers can be saved in real time, allowing you to check logs in the container environment whose lifecycle is not constant. Without accessing containers individually, focus on log analysis by categorizing and indexing main content, including meaningful information generated from applications.
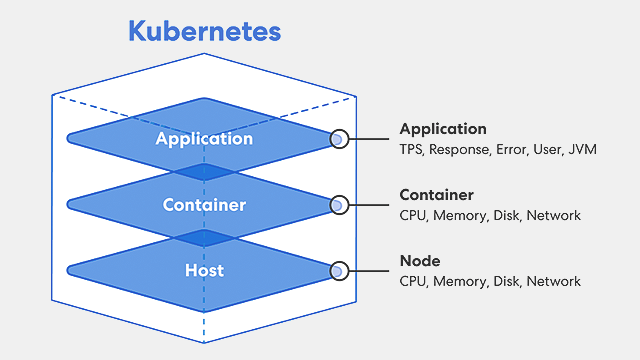
You can find root causes by monitoring the host, container, and application all at once.
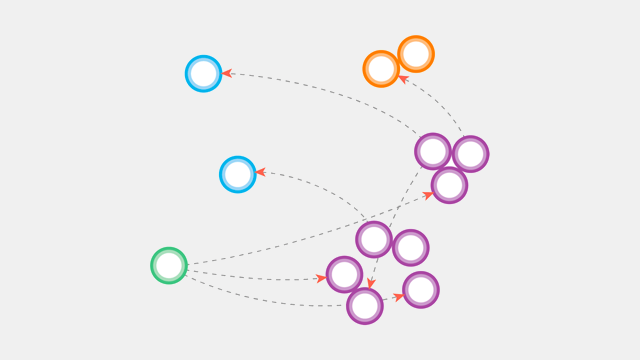
WhaTap Kubernetes Monitoring tracks the API call relations for transactions in a POD (application environment).
Kubernetes Integrated Monitoring supports both multi and hybrid cloud.


