Collects data generated from more than 10,000 servers by seconds, analyzes and informs you of momentary overload and performance degradation in real-time.
By providing various types of dashboards for integrated monitoring, you can see the overall system status in real-time. In particular, in case of monitoring overwhelmingly large resources, the trend of top N resources with high utilization can be easily grasped by using the TopN board on Flex board. It is also possible to monitor resources without missing any surge of resources.
The server list in a table allows you to select the items to display. This enables real-time monitoring as well as inventory management for small and medium servers.
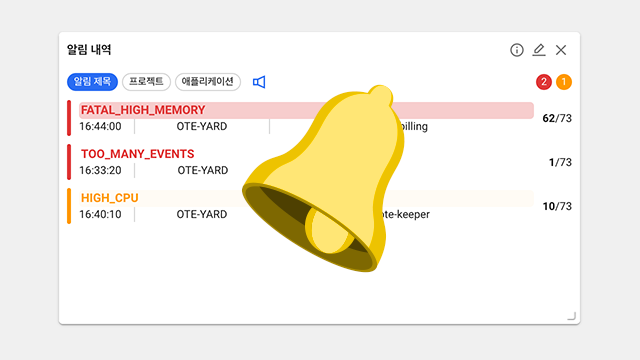
The real-time integrated alerts free you from monitoring resource trends to spot failures. This function allows you to find service failures based on the real-time notification history. It also lets you search for notifications by server, process, or keyword.
For operators who have to operate a large number of resources stably, creating data manually for reporting is a hassle. WhaTab provides various types of reports for ease of work. In addition, if you want a report, available report types are provided.
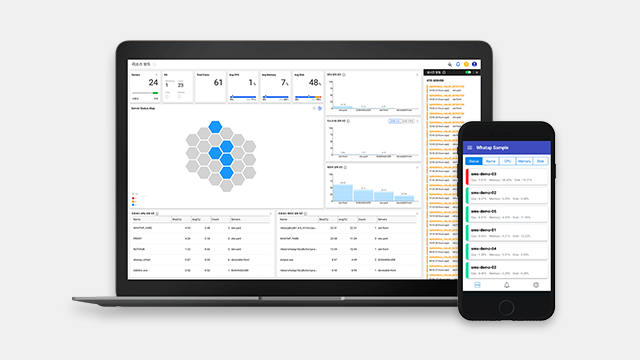
With a service type web application (https://service.whatap.io) and mobile app (android, ios), you can monitor and receive notifications in real time anytime, anywhere.
WhaTap Server Monitoring provides automatic detection and notification of vulnerabilities that may occur in cloud applications.
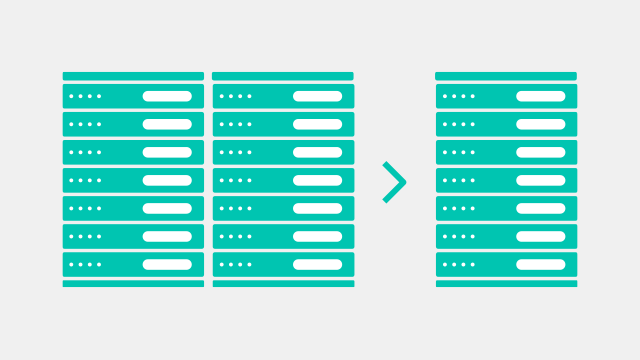
The desired server size may differ every year. If you are using the cloud system, it may differ monthly, weekly, or in real time. Through monitoring you can forecast it and calculate the appropriate size.
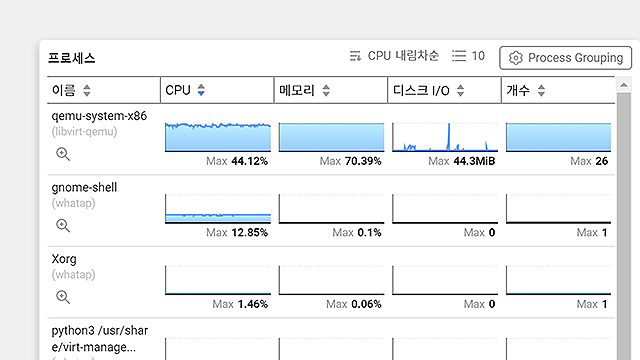
WhaTap Server Monitoring automatically collects the CPU, memory, and IO usage of all processes every 20 seconds.
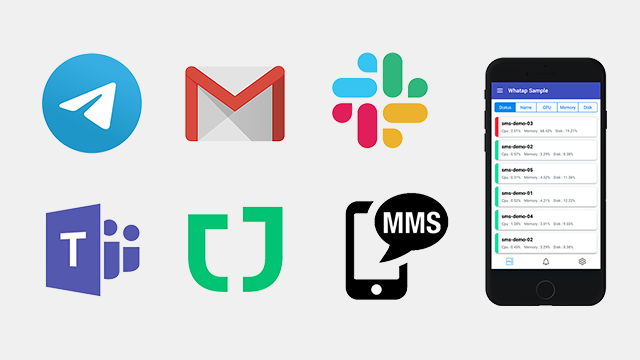
We provide personalized notification by using email, mobile push, and 3rd party plugin.
※ WhaTap mobile-dedicated app is provided by default only in Public SaaS.
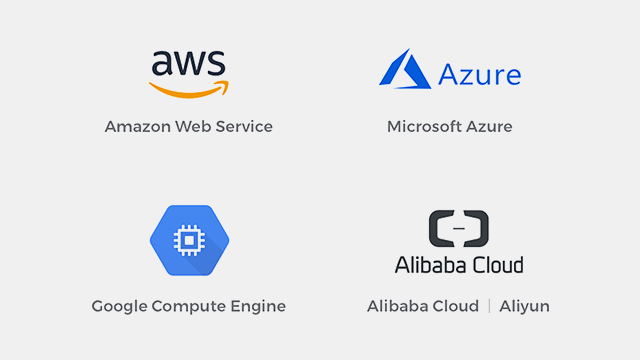
WhaTap Server Monitoring provides the indicators (e.g. physical server and cloud environment) suitable for monitoring, and it is applicable to the scale-out environment.